Elementor widget · Content & Text
Simple Chart
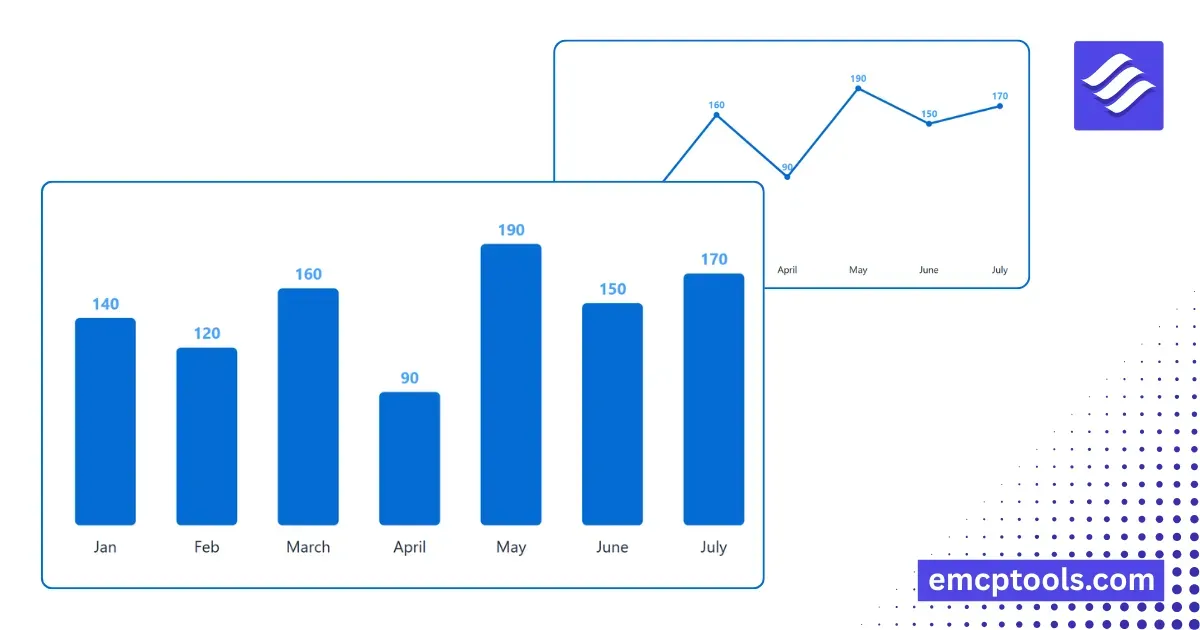
A lightweight, dependency-free bar & line chart for Elementor. Add data points, pick a style, and it animates in — pure SVG, no libraries.
About this elementor widget
A self-contained data chart for Elementor — perfect for stats, KPIs, results, and simple comparisons. Pure inline SVG with a smooth draw-in animation; no chart libraries, no external requests.
Features
- Bar or Line chart from a simple list of data points (label + value)
- Animated on scroll — bars rise, the line draws itself in
- Auto or fixed max value; optional value labels on each point
- Styleable series, label, and value colors
- Ships with starter data so it previews the moment you add it
Responsive and lightweight; renders live in the Elementor editor and on the frontend.