
Website Monitoring
Open Account → Monitoring to see your connected websites. Choose a site to enable monitoring and select a check interval of 2, 5, 15 or 60 minutes. Monitoring requires a Cloud plan with Gateway access. New monitors start collecting data after you save; previous uptime is not reconstructed.
What the checks cover
Section titled “What the checks cover”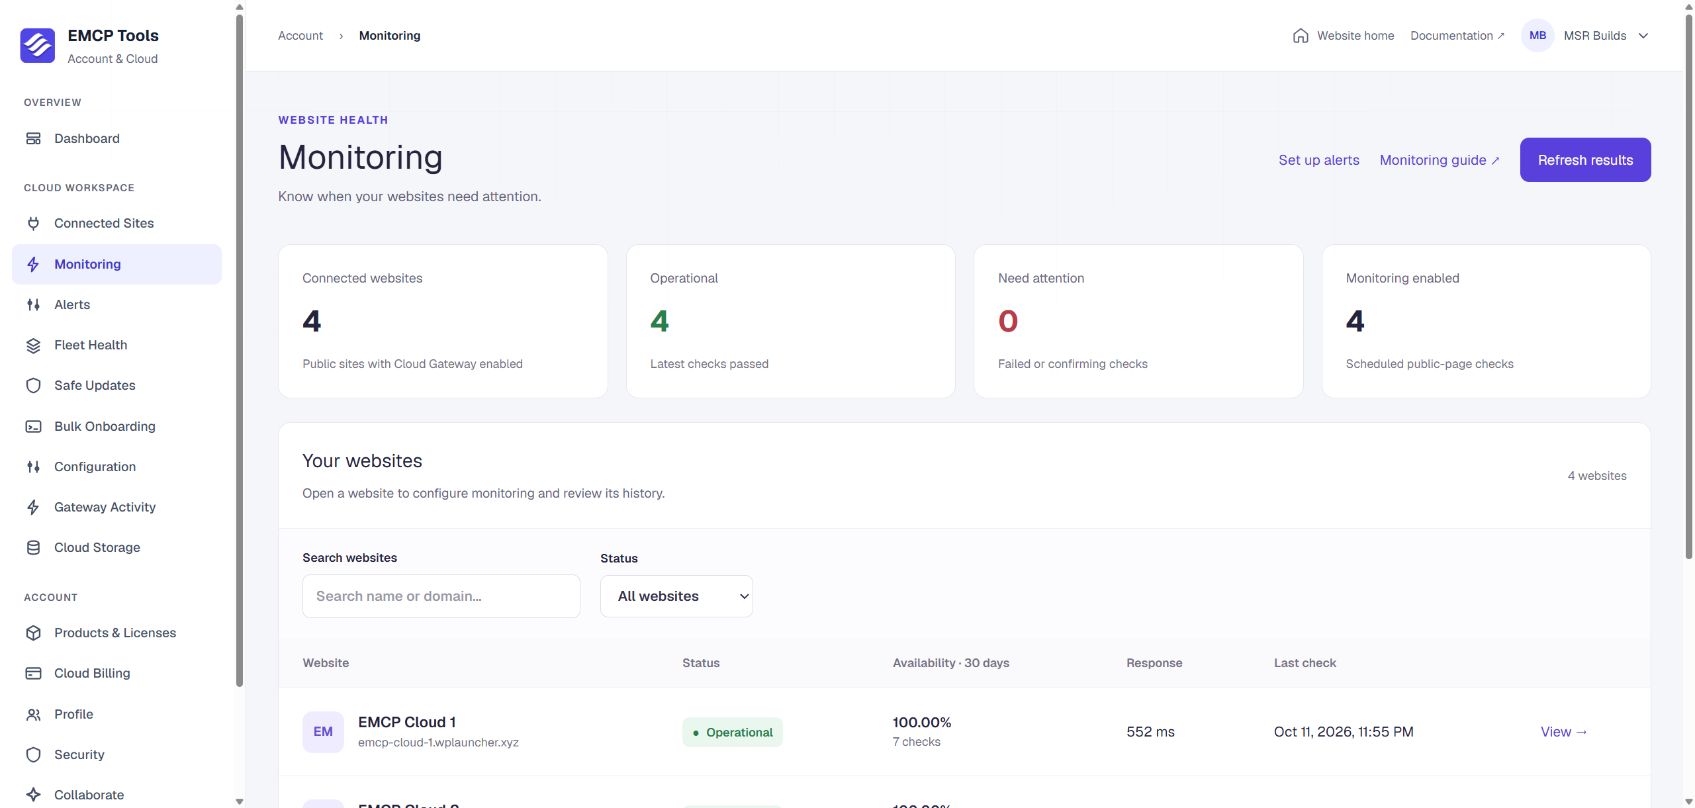
The overview brings your eligible websites together. Select a website to open its monitoring settings and history. Select any screenshot to enlarge it.
EMCP Cloud requests the connected site’s public HTTPS URL and checks its HTTP response, page content for visible WordPress critical errors, response time and SSL certificate expiry. Requests carry no WordPress credentials. Same-origin redirects are followed; a redirect to another origin is reported so you can correct the connected site URL.
Checks run from the EMCP Cloud worker. Geographic region selection, registrar domain expiry, screenshot comparison, PHP log collection and checkout testing are not included. Cached pages may still look healthy when the origin has a problem; these public checks complement the authenticated checks used during Safe Updates.
Reading the dashboard
Section titled “Reading the dashboard”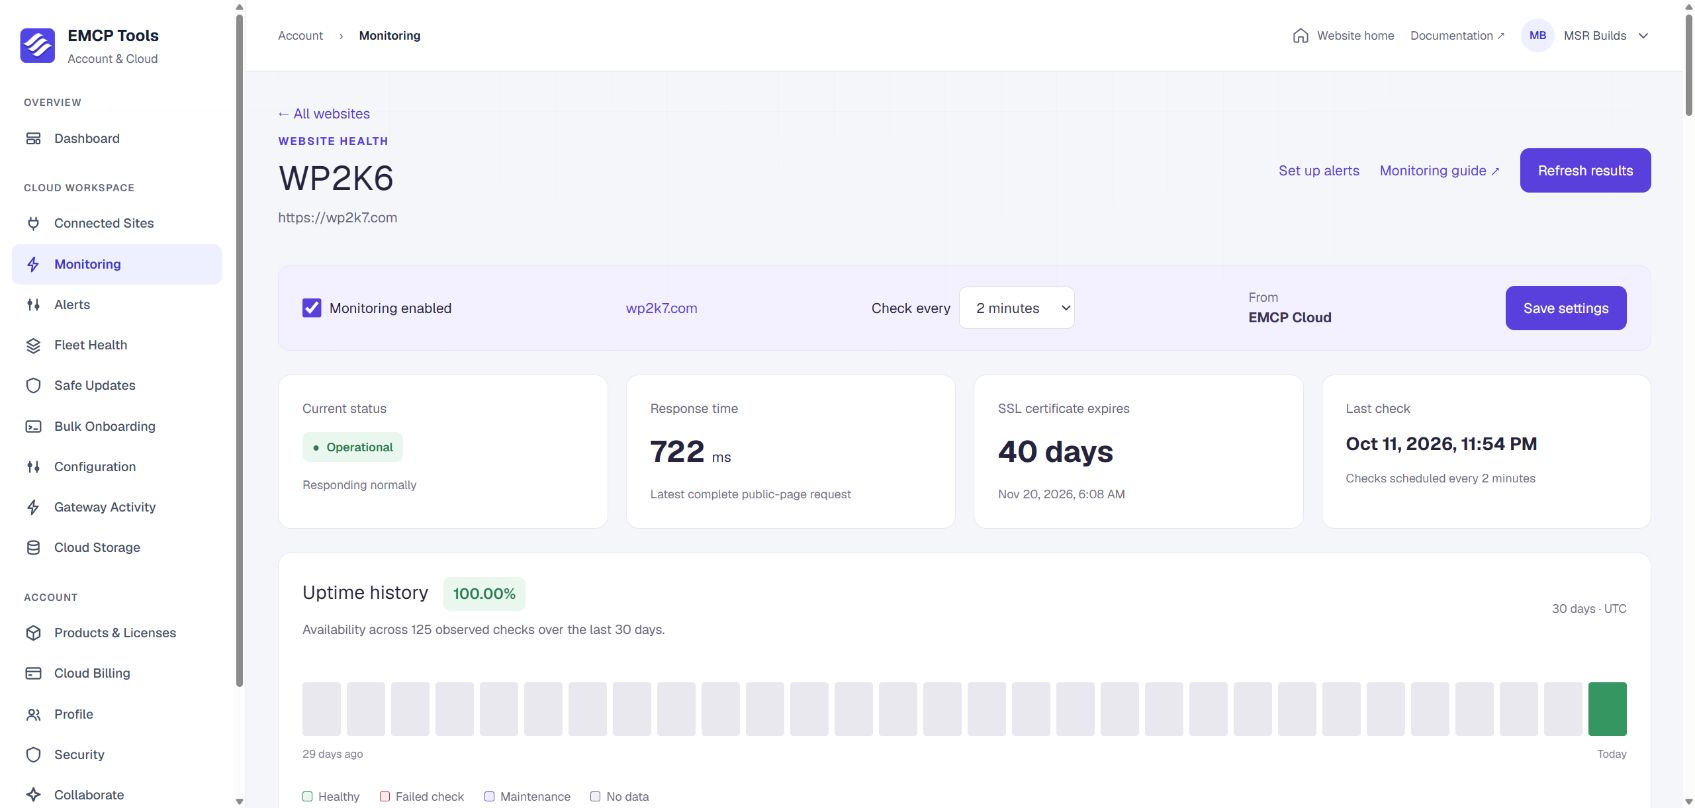
The site detail page combines monitoring settings with the latest check results. Gray history bars mean no checks were recorded on those days; they do not indicate an outage.
- Operational: the latest fresh check passed.
- Confirming issue: one check failed; the next scheduled check will confirm whether an incident should open.
- Down: two or more consecutive checks failed.
- Awaiting check: no result yet, or the worker has not reported within two check intervals plus one minute. Old successful results are never presented as current health.
- Maintenance: a Safe Updates job is active or needs recovery attention. These observations are excluded from availability calculations.
- Paused: monitoring is disabled; retained results are still available.
The 30-day chart shows daily results in UTC. Select a day for counts. Availability is the percentage of observed checks that succeeded, not a continuous uptime guarantee. Missing checks and maintenance are excluded. Response time includes fetching the public page; it is not a browser performance score.
Incidents and recovery
Section titled “Incidents and recovery”Two consecutive failures create one incident, timestamped from the first failure. A successful check closes it. The timeline records the observed failure reason, start, recovery and elapsed duration. Alerts appear in the dashboard. To receive email, Slack or SMS notifications, configure destinations under Account → Alerts. Set up alerts.
History is retained for 30 days, with unresolved incidents retained until resolved. Pausing monitoring does not erase history or claim an outage has recovered. If a site is disconnected, it is no longer checked. If the monitor owner’s Cloud access is revoked, the worker disables its monitor.
Monitoring and Safe Updates
Section titled “Monitoring and Safe Updates”Monitoring pauses observations while a Safe Updates run is active or requires attention, preventing planned maintenance from opening a new incident. Safe Updates still performs its own authenticated homepage and login checks before moving to the next update group. Read the Safe Updates guide.