
MCP Log
MCP Log records the requests connected AI clients send to this site, so you can see what a client actually did and why a call failed. Open EMCP Tools → Safety → MCP Log (admin.php?page=emcp-tools-mcp-log). It is free.
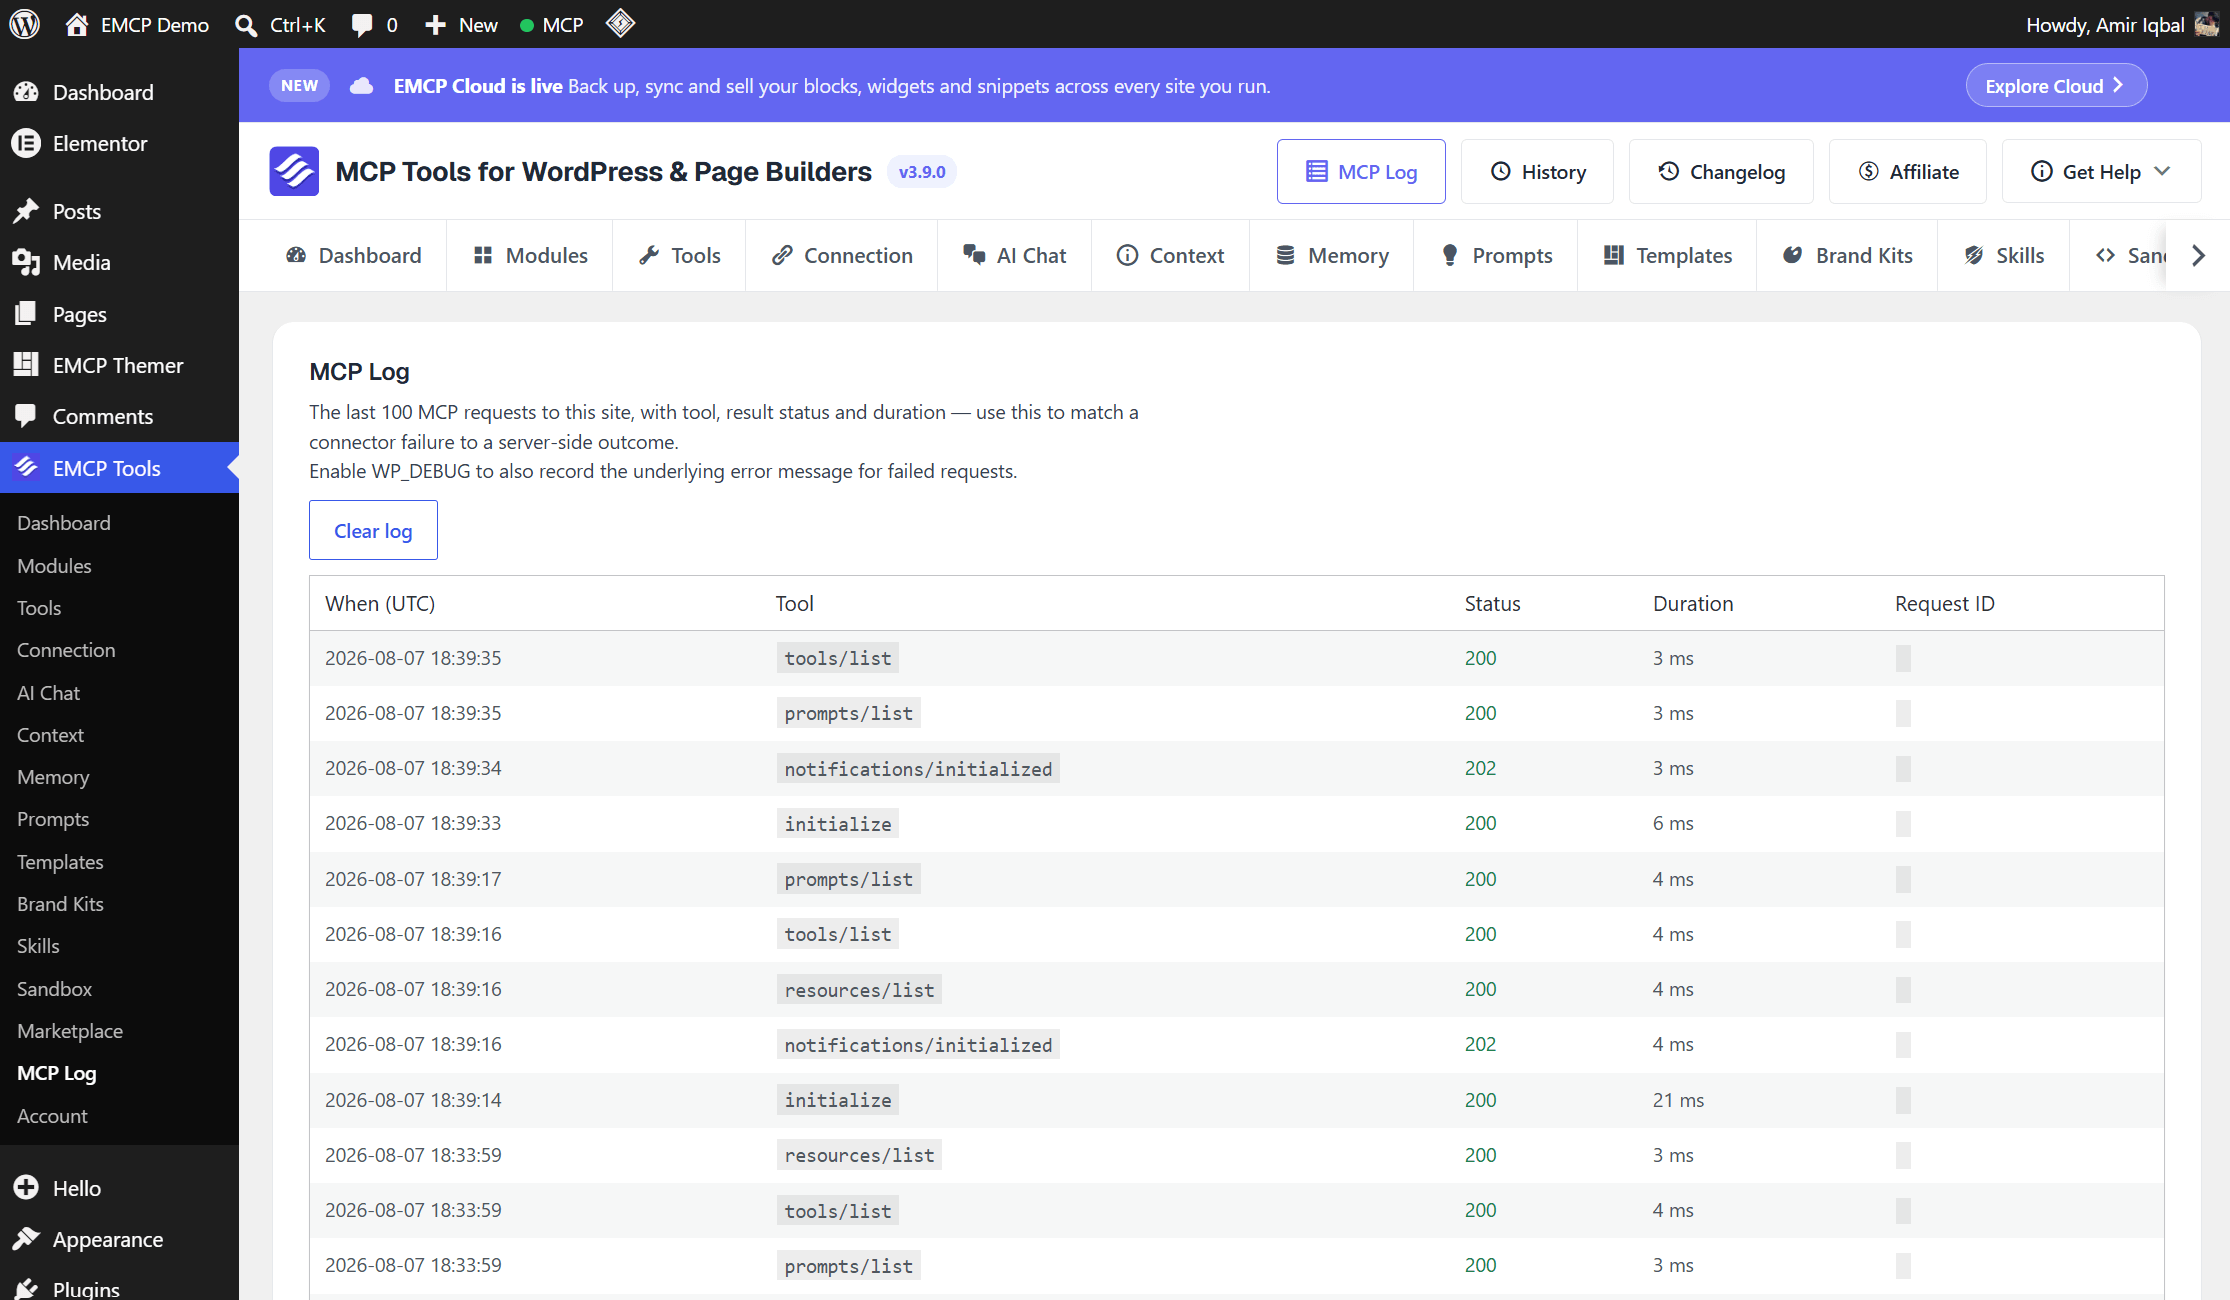
What is recorded
Section titled “What is recorded”- Every routed JSON-RPC request, on every transport: HTTP (direct, the Node proxy, OAuth apps) and the WP-CLI stdio server (
wp mcp-adapter serve). That includesinitialize,tools/list,tools/calland notifications. - HTTP requests that never reached a tool. Requests refused before routing also get a row: an invalid or expired session, an unsupported
MCP-Protocol-Version, a body that is not valid JSON-RPC (logged asinvalid), and a wrong Application Password. - The newest 500 requests. Older rows drop off as new ones arrive.
- Requests with no signed-in user are rate-limited to one row per client address every 30 seconds, so a scanner hammering the endpoint cannot push real requests out of the log. A burst of failed sign-ins therefore shows as a single row.
Nothing a client sends as tool arguments is stored, and full error messages are kept only while WP_DEBUG is on.
Four figures at the top cover every stored request, not just the current page:
- Requests: how many are stored.
- Errors: how many failed.
- Median: the median duration.
- Slowest: the longest duration, with the tool or method that took it.
Filters and paging
Section titled “Filters and paging”- Search requests matches the method, tool name, client, request ID and failure reason (and the error text while
WP_DEBUGis on). - Status: All, Success or Errors.
- Time zone changes only how times are shown: Site time (with its offset, for example “+00:00”), UTC or Browser time. The choice is remembered in this browser.
The MCP requests table shows 50 requests per page, newest first, with these columns:
| Column | Shows |
|---|---|
| Time | When the request arrived, in the chosen time zone |
| Request | The tool name, with the JSON-RPC method (for example tools/call) under it |
| Status | SUCCESS or ERROR |
| Duration | Milliseconds, with a bar scaled to the slowest request on the page |
| Request ID | The JSON-RPC request ID, with Copy request ID |
| Details | Show more / Show less |
Row details
Section titled “Row details”Show more opens the details of one request. Only fields that have a value appear:
| Field | Meaning |
|---|---|
| Client | The OAuth app name, the Application Password name, “HTTP” or “WP-CLI” |
| Session | The MCP session ID for HTTP, or an identifier for the WP-CLI process |
| Credential | Which credential signed the request: app: with the Application Password’s ID, oauth: with the app, or cli: for WP-CLI |
| Stage | For a failed request, where it failed, for example transport for a request rejected before it reached a tool |
| Failure reason | The short reason a request failed, for example “Post not found.” |
| Error | The full error message, only while WP_DEBUG is on |
| History entry | The ID of the History entry the call recorded, or not_recorded if its change could not be added |
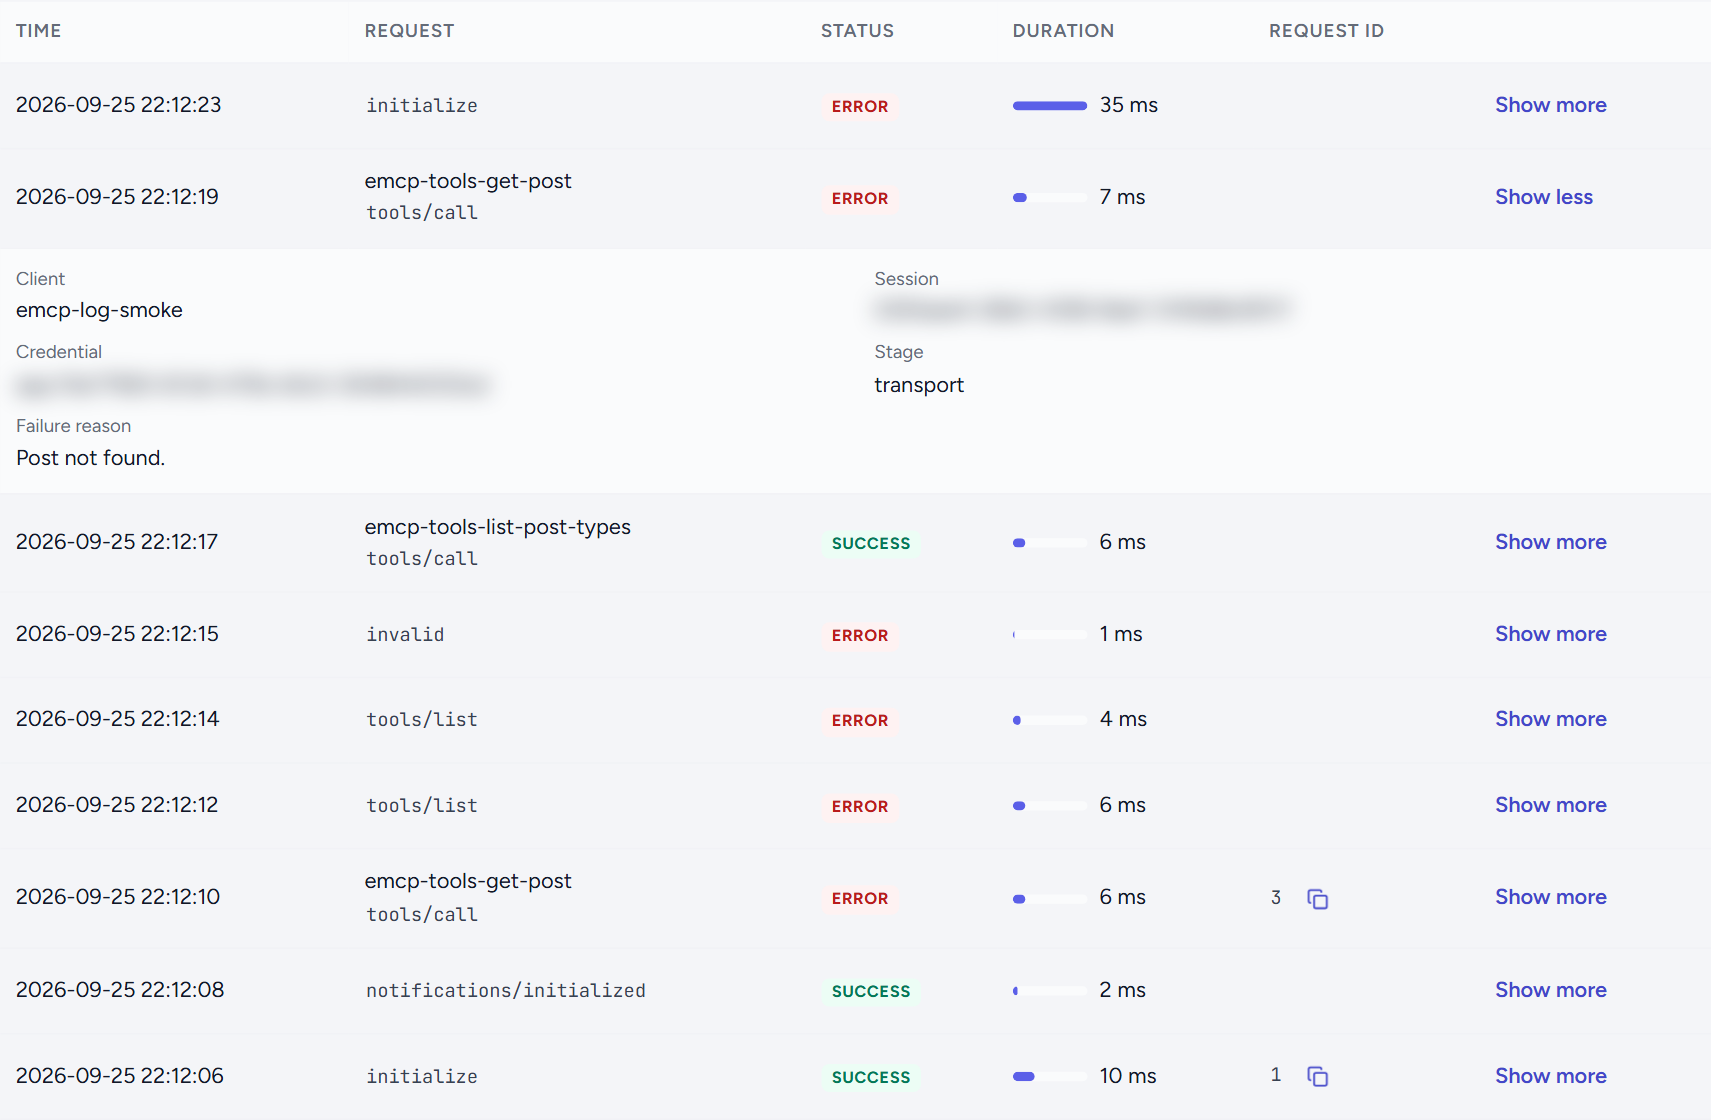
Session and credential values identify a connection. They are not passwords, but blur or remove them before sharing a screenshot.
Export CSV
Section titled “Export CSV”Export CSV downloads the requests that match the current status filter and search, newest first. Columns: time_utc, method, tool, status, ms, request_id, client, session, credential, stage, failure_reason, plus error while WP_DEBUG is on. Times in the file are always UTC, whatever time zone the screen shows.
The file is safe to open in a spreadsheet: any cell that starts with =, +, -, @, a tab or a carriage return gets a leading apostrophe, and so does such a character after a ; inside a cell, so a spreadsheet never runs a value as a formula.
Clear log
Section titled “Clear log”Clear log asks “Clear the MCP log?” and then deletes every stored request. This cannot be undone. It does not touch History.
Troubleshooting with the log
Section titled “Troubleshooting with the log”Reading a failed call. Reproduce the problem once, set status to Errors and search for the tool or method. Show more on the row gives the failure reason; with WP_DEBUG on you also get the full error. Match the row to your client’s error by time (set Time zone to your client’s clock) or with Copy request ID.
What the pattern tells you:
- No rows at all for your attempt: the request never reached WordPress. Check the URL, HTTPS and any proxy, firewall or CDN in front of the site. See No tools appearing.
initializefails, or every request fails with no signed-in user: an authentication problem. See Auth errors. Remember that unsigned-in requests appear at most once per 30 seconds per address.initializeandtools/listsucceed, then onetools/callfails: the connection is fine; the failure reason explains the tool’s own error (missing post, missing permission, invalid input).- A write you expected is missing from History: check the row’s History entry field.
When you ask for support, share the request ID and the failure reason rather than a screenshot of the details, or blur the session and credential first.
Related
Section titled “Related”- History: the changes those calls made, with undo.
- No tools appearing and Auth errors.